FREE MEETING: KEY TRENDS AND RISKS IN TRADING GAMES– REGISTER

  • CONTACT
  • MARKETCAP
  • BLOG
TradingGem
Sign In
  • BOOKMARKS
  • Prop Firms
  • News
    Hamster Kombat Binance Listing
    MarketCrypto

    Hamster Kombat Binance Listing

    Introduction Hamster Kombat Binance listing marks a pivotal moment in the cryptocurrency…

    By TradingGem
    August 1, 2024
    What you need to know about Binbex
    Binary TradingBlockchainCryptoMarketTrading Strategy
    Binbex: Everything You Need to Know about The Platform
    Top best Crypto coin faucet 2024
    CryptoBlockchainMarket
    Top Crypto Coin Faucets to Earn Crypto in 2024.
    youhodler review
    CryptoMarket
    Youhodler Review – You should know
    exness broker review
    Market
    Exness Broker Review
  • Crypto
  • Forex
  • Stock
  • Market
  • Binary Trading
  • Customize Interests
Reading: All Candlestick Patterns PDF Download
Share
TradingGemTradingGem
Font ResizerAa
  • Crypto
  • Binary Trading
  • Stock
  • Forex
  • Blockchain
  • Market
Search
  • Home
  • Prop Firms
  • Categories
    • Market
    • Crypto
    • Stock
    • Forex
    • Binary Trading
    • Blockchain
  • Bookmarks
    • My Bookmarks
    • Customize Interests
Have an existing account? Sign In
Follow US
© 2023 TradingGem. All Rights Reserved.
TradingGem > Resource > All Candlestick Patterns PDF Download
Resource

All Candlestick Patterns PDF Download

TradingGem
Last updated: February 15, 2025 6:02 am
TradingGem
Published: August 29, 2024
Share
All Candlestick Patterns PDF Download
All-Candlesticks-patterns-pdfDownload

Introduction to Candlestick Patterns

What Are Candlestick Patterns?

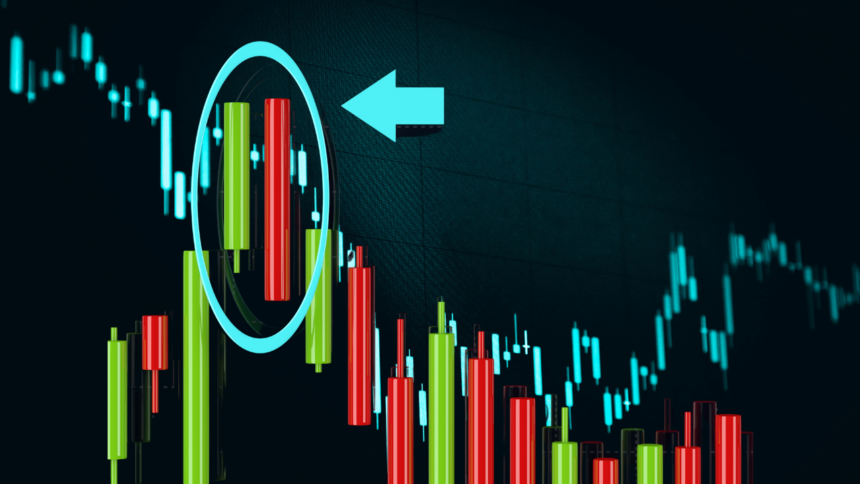
Candlestick patterns are visual representations used in technical analysis to depict price movements of financial instruments over a specific period. They are named “candlesticks” because of their shape, which resembles a candle with wicks. These patterns are formed by the opening, closing, high, and low prices of the trading day. By examining these patterns, traders can infer potential future price movements and make informed trading decisions.

Contents
Introduction to Candlestick PatternsBasic Components of a CandlestickCommon Types of Candlestick PatternsPopular Candlestick Patterns for TradersUsing Candlestick Patterns in TradingBenefits of Having a Candlestick Patterns PDFHow to Download the All Candlestick Patterns PDF

History of Candlestick Patterns

Candlestick charting was developed in the 18th century by Munehisa Homma, a Japanese rice trader. Homma realized that emotions influenced the price of rice as much as supply and demand. He devised a method to capture this sentiment visually, giving birth to the candlestick chart. Over time, this technique was refined and is now widely used in modern financial markets across the globe.

Importance of Candlestick Patterns in Trading

Candlestick patterns are crucial for traders because they provide a quick visual cue about market sentiment and potential reversals. Unlike bar charts or line charts, candlestick charts are more informative, allowing traders to understand market psychology at a glance. This ability to quickly interpret data helps traders anticipate price movements and adjust their strategies accordingly.

Basic Components of a Candlestick

Understanding the Anatomy of a Candlestick

A candlestick is composed of a body and two wicks (also known as shadows). Here’s a breakdown of these components:

  • Body: The thicker part of the candlestick, which represents the range between the opening and closing prices. If the closing price is higher than the opening price, the body is typically hollow or green, indicating a bullish trend. Conversely, if the closing price is lower than the opening price, the body is filled or red, signifying a bearish trend.
  • Wicks (Shadows): These are the thin lines extending above and below the body, representing the high and low prices of the period. The upper wick shows the highest price, while the lower wick shows the lowest price.

Bullish vs. Bearish Candlesticks

  • Bullish Candlesticks: These indicate that the price closed higher than it opened, suggesting a potential upward trend. They are often colored green or white.
  • Bearish Candlesticks: These indicate that the price closed lower than it opened, suggesting a potential downward trend. They are usually colored red or black.

Common Types of Candlestick Patterns

Candlestick patterns are categorized into single, double, and triple patterns, each providing different levels of insight into potential price movements.

Single Candlestick Patterns

These patterns consist of a single candlestick and are simple yet powerful indicators of market trends.

  • Doji: A candlestick with a very small body, where the opening and closing prices are nearly the same. It suggests indecision in the market.
  • Hammer: A candlestick with a small body and a long lower wick, indicating potential bullish reversal after a downtrend.
  • Shooting Star: A candlestick with a small body and a long upper wick, indicating potential bearish reversal after an uptrend.

Double Candlestick Patterns

These involve two consecutive candlesticks and can signal stronger potential reversals or continuations.

  • Engulfing Pattern: Occurs when a smaller candlestick is followed by a larger candlestick that completely “engulfs” the previous one. A bullish engulfing pattern suggests a bullish reversal, while a bearish engulfing pattern suggests a bearish reversal.
  • Harami Pattern: This pattern occurs when a larger candlestick is followed by a smaller one, fitting within its range. A bullish harami indicates a potential bullish reversal, and a bearish harami suggests a bearish reversal.

Triple Candlestick Patterns

These patterns involve three consecutive candlesticks and are often used to confirm trends.

  • Morning Star: A bullish reversal pattern consisting of a large bearish candle, a small-bodied candle (which can be bullish or bearish), and a large bullish candle. It signals the end of a downtrend.
  • Evening Star: A bearish reversal pattern consisting of a large bullish candle, a small-bodied candle, and a large bearish candle. It signals the end of an uptrend.

Popular Candlestick Patterns for Traders

Let’s explore some of the most popular candlestick patterns that traders commonly use to make informed decisions:

Doji

The Doji pattern is a crucial indicator of market indecision. It forms when the opening and closing prices are nearly equal, resulting in a very small or non-existent body. Traders interpret a Doji as a sign that the market is uncertain, and a potential reversal may be on the horizon, especially when it appears after a strong bullish or bearish move.

Hammer and Hanging Man

The Hammer and Hanging Man are two similar-looking candlestick patterns but indicate different market conditions:

  • Hammer: Appears after a downtrend and is characterized by a small body with a long lower wick. It signals that buyers are stepping in to drive prices higher, indicating a potential bullish reversal.
  • Hanging Man: Appears after an uptrend with a similar shape to the Hammer but suggests a bearish reversal as selling pressure increases.

Engulfing Patterns

Engulfing patterns are powerful reversal indicators consisting of two candles:

  • Bullish Engulfing: A small bearish candle followed by a large bullish candle that completely engulfs it. It suggests a strong buying momentum and a potential reversal from downtrend to uptrend.
  • Bearish Engulfing: A small bullish candle followed by a large bearish candle that engulfs it, indicating strong selling momentum and a potential reversal from uptrend to downtrend.

Morning Star and Evening Star

These are triple candlestick patterns indicating reversals:

  • Morning Star: Appears at the end of a downtrend and is a bullish reversal pattern. It consists of a large bearish candle, a small-bodied candle (indicating indecision), and a large bullish candle, signaling a shift in momentum from sellers to buyers.
  • Evening Star: Appears at the end of an uptrend and is a bearish reversal pattern. It consists of a large bullish candle, a small-bodied candle, and a large bearish candle, indicating a shift in momentum from buyers to sellers.

Shooting Star

The Shooting Star is a bearish reversal pattern that forms after an uptrend. It has a small body, a long upper wick, and little or no lower wick, indicating that buyers pushed the price up, but sellers managed to drive it back down.

Using Candlestick Patterns in Trading

Interpreting Market Sentiment

Candlestick patterns are more than just visual tools; they provide insights into market sentiment and psychology. Understanding these patterns helps traders predict future price movements, allowing them to make more informed decisions.

Combining Candlestick Patterns with Other Indicators

While candlestick patterns are powerful tools on their own, combining them with other technical indicators such as moving averages, relative strength index (RSI), and Bollinger Bands can provide more robust trading signals. This combination helps confirm potential reversals or continuations, improving trading accuracy.

Common Mistakes to Avoid

  • Over-reliance on Patterns: Candlestick patterns are not foolproof and should not be used in isolation. They are most effective when combined with other technical analysis tools.
  • Ignoring Market Context: Always consider the broader market context and avoid making decisions based solely on a single candlestick pattern.
  • Failing to Confirm Reversals: Before acting on a potential reversal signal, wait for confirmation from subsequent price action or other indicators.

Benefits of Having a Candlestick Patterns PDF

Easy Access to Information

A PDF guide compiling all candlestick patterns allows traders to have instant access to crucial information. This can be especially helpful for beginners who are still learning the various patterns and their meanings.

Quick Reference for Trading Decisions

During fast-paced trading sessions, having a PDF guide at hand allows traders to quickly reference patterns without wasting valuable time searching for information.

Enhancing Trading Knowledge

A comprehensive PDF guide not only serves as a quick reference but also as a learning tool. By studying different candlestick patterns and their implications, traders can enhance their understanding and develop more effective trading strategies.

How to Download the All Candlestick Patterns PDF

Step-by-Step Guide to Downloading

  1. Visit a Trusted Website: Make sure you download the PDF from a reputable website that offers high-quality trading resources. For your convenience, you can also download the comprehensive “All Candlestick Patterns PDF” directly from our website using the link or button provided below.
  2. Search for the PDF: If you’re exploring other websites, use the search bar to find the “All Candlestick Patterns PDF.”
  3. Click on the Download Link: Once you find the PDF on any site, click on the download link. Some websites may require you to sign up or provide your email address. However, on our website, you can directly download the file with just a click.
  4. Save the File: Choose a location on your device to save the PDF for easy access.

Download the All Candlestick Patterns PDF Now

To download the “All Candlestick Patterns PDF,” click the button below:

Download PDF Now

By downloading from our site, you ensure you’re getting a comprehensive, high-quality guide that covers all major candlestick patterns, detailed descriptions, visual illustrations, and practical trading tips.

What’s Included in the PDF?

The PDF from our website includes:

  • Detailed Descriptions: Each candlestick pattern is explained in detail to help you understand its significance and implications.
  • Visual Illustrations: Clear and concise visuals accompany each pattern, making it easier to recognize them in real-time trading.
  • Practical Trading Tips: Learn how to use each pattern effectively in your trading strategies.
  • Additional Resources: Access to exclusive articles, video tutorials, and webinars to enhance your trading knowledge.

Additional Resources and Tools

Our website offers a range of additional resources, including video tutorials, webinars, articles, and more, all designed to help you broaden your knowledge and improve your trading strategies. Be sure to take advantage of these materials to deepen your understanding and enhance your trading skills.

Sign Up For Daily Newsletter

Be keep up! Get the latest breaking news delivered straight to your inbox.
By signing up, you agree to our Terms of Use and acknowledge the data practices in our Privacy Policy. You may unsubscribe at any time.
Share This Article
Facebook Email Copy Link Print
Previous Article Hamster Kombat Binance Listing Hamster Kombat Binance Listing
Next Article Pambi Coin New Meme Token Revolution Pambi Coin New Meme Token Revolution
Leave a Comment

Leave a Reply Cancel reply

Your email address will not be published. Required fields are marked *

Popular News
how to trade in bank nifty complete guide
How to trade in bank nifty? Complete Guide
best binary trading platforms
Best binary trading platform
9 best crypto trading platforms
9 Best Crypto Trading Platforms
- Advertisement -
Ad image

Follow US

Find US on Socials
1.1kLike
200Follow
1.5kSubscribe
1.5kFollow
Subscribe to our newslettern

Get Newest Articles Instantly!

Disclaimer: The information provided on this website is for educational and informational purposes only. It should not be construed as financial advice. Trading involves risk, and past performance is not indicative of future results. Always do your own research and consult with a qualified financial advisor before making any investment decisions. We do not endorse or guarantee the accuracy of third-party content or links provided on this site. By accessing this website, you agree to the terms of use and disclaimer.

Follow Us on Socials

We use social media to react to breaking news, update supporters and share information

Facebook Instagram Linkedin Twitter Youtube
TradingGem

Welcome to TradingGem, where trading expertise meets tech innovation and digital strategy for your financial success.

  • Crypto
  • Binary Trading
  • Stock
  • Forex
  • Blockchain
  • Market
  • Crypto
  • Binary Trading
  • Stock
  • Forex
  • Blockchain
  • Market
- Advertisement -
Ad image
© 2023 TradingGem. All Rights Reserved.

Login

Sign in to your account
Lost password?
Create New Account
Welcome Back!

Sign in to your account

Username or Email Address
Password

Lost your password?

Not a member? Sign Up